How to implement the visual processing module for pose calibration in RatSLAM?
In this report, I summarized some key methods for visual processing module in RatSLAM or RatSLAM-based System. There are more than six approaches as following. By comparing and doing some practical experiments, I think that the intensity scanline profile and feature matching approaches are good for the visual processing module.
Approach 1: Features based visual template matching
Step1 Features Extraction
Step2 Features Matching
Compare the current image with all visual templates
If there are some available features matched
Get the distances, then get the minimum distance.
If the minimum distance is more than the vt_threshold,
add a new template and associating with the current direction
Else
Is a familiar scene
End
Biologically inspired visual landmark processing for simultaneous localization and mapping
(Feature extraction and template matching)
Prasser, D. P., et al. 2004 proposed a method, which is based loosely on biological principles, using layers of filtering and pooling to create learned templates that correspond to different views of the environment.
Rather than using a set of landmarks and reporting range and bearing to the landmark, this system maps views to poses.
The challenge is to produce a system that produces the same view for small changes in robot pose, but provides different views for larger changes in pose.
The complex cells of the visual cortex are generally considered to detect or respond to edges or bars at a particular orientation within a region of the retina, which is known as the cell’s receptive field.
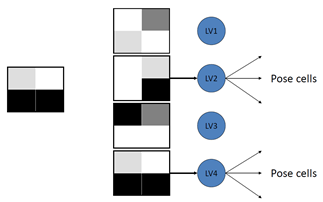
Vision information is converted into a local view representation which if familiar, injects activity into the particular pose cells that are associated with that specific local view.
Significantly the local view contains no explicit spatial information such as distance and bearing to a landmark, instead RatSLAM learns to associate visual appearance with different poses. The approach has two levels: a biologically motivated feature extraction of the image using the complex cells; followed by a primitive scene recognition stage.
The units in the local view are controlled by a two stage computer vision system.
The first stage uses a complex cell model to extract features from the image. These features are then used to represent the image.
The second stages uses a sum of absolute differences metric to compare the output of the complex cells against previously learnt templates. Each template has a corresponding local view unit which is activated when the input matches the template.
A. Feature Extraction
The complex cell model used in this method is based on the first layer of D.H. Hubel. 1988. In this model the input image is first normalized and then convolved with a number of odd Gabor filters to produce edge detected images. Each of these is then passed through a winner-takes-most mechanism across the orientation dimension. In the current implementation only two orientations are used for the complex cell filters- horizontal and vertical.
B. Template Matching
The output of the complex cell filters is input for a sum of absolute differences (SAD) module. The SAD module operates as a learning system that compares the input against a preciously learned set of templates. When the minimum distance between any of the learnt set and the input is larger than a threshold  the input is added to the set as a new template.
The output of the SAD module is a linear vector of cells each of which corresponds to one particular template. The activity level of a cell, , varies between 0 and 1, and is given by:
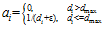 (1)
(1)
where is introduced to avoid infinite activation levels when the distance is zero, and
  is a distance threshold. The distance,
 , is the sum of absolute differences between pixel intensity values in the template and the current image and is given by:
 (2)
(2)
where  is the intensity value of the
  pixel in the visual template associated with cell
  , and
, and  is the value for the
 pixel in the current camera image. The total activity level in the set of local view cells is normalised to unity.
Finally the cell activation if normalized to unity over all of the LV cells. By using this representation the SAD module can respond to uncertain matches by weakly activating two or more cells rather than just signalling the most correct template. The performance of the SAD module is chiefly controlled by the  parameter. Large values for this parameter will result in a small number of more ambiguous templates being found, whereas small values will produce many highly specific templates.
At several points in the environment the complex cell outputs can be all zero or very near zero. This causes a template to form which represents seeing no features. The frequency with which this template is found means that this template contributes no useful information to the RatSLAM system and does not help in localization. To prevent this, there is a special template that corresponds to the case of no visual input. This template has no corresponding LV unit and is never linked to any pose cells.
The vision system implements a crude form of expectation within the template matching process. In an ideal situation the order in which templates are added to the set of learned templates will correspond roughly to the relative physical position of the templates. The system uses the best template match from the previous frame, template b, as the input to an expectation system which suppresses templates that are not nearby in template index. This means the pose cell system now needs two frames before it can start to recover from global kidnapping.
Prasser, D. P., Gordon Fraser Wyeth, and M. J. Milford. “Biologically inspired visual landmark processing for simultaneous localization and mapping.” In Intelligent Robots and Systems, 2004.(IROS 2004). Proceedings. 2004 IEEE/RSJ International Conference on, vol. 1, pp. 730-735. IEEE, 2004.
Approach 2: Intensity Scanline Profiles based visual template matching
David Ball, et al. 2013 utilizes the intensity scanline profiles based visual template matching in OpenRatSLAM.
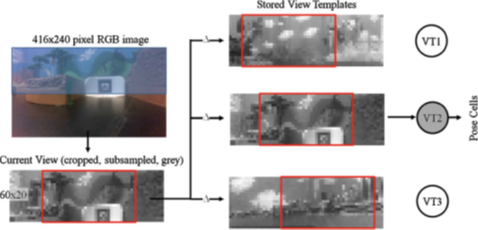
Place recognition using view templates for the iRat dataset. The bottom half of the image is discarded by cropping, as it contains perceptually ambiguous black floor. The Local View node compares the copped, sub-sampled and grayscale current view to all of the stored view templates to find the best match. The delta operator indicates that comparisons are made while shifting the current view and visual templates relative to each other. The result is the currently active view template, which may be a new view template.
Sum of Absolute Differences Module
The 96-pixel images are processed by a Sum of Absolute Differences (SAD) module that produces the local view (Prasser, Wyeth et al. 2004). The SAD module compares each image with its repository of stored template images. New images that are sufficiently similar to template images are re recognised as such, while significantly different images are learned as new image templates and added to the repository.
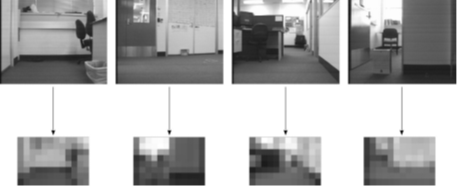
High resolution and down sampled greyscale camera images. The low resolution 12 × 8 pixel images are used by the RatSLAM system.
Using this vision module, the local view consists of a one-dimensional array of cells, with each cell corresponding to a particular image template. The activity level of a cell, , varies between 0 and 1, and is given by:
 (1)
(1)
where is introduced to avoid infinite activation levels when the distance is zero, and
  is a distance threshold. The distance,
 , is the sum of absolute differences between pixel intensity values in the template and the current image and is given by:
 (2)
(2)
where  is the intensity value of the
  pixel in the visual template associated with cell
  , and
, and  is the value for the
 pixel in the current camera image. The total activity level in the set of local view cells is normalised to unity.
The SAD vision processing method suited the indoor environments and robot movement scheme. The corridor and wall following movement behaviours and small field of view forward facing camera ensured that the robot only learned forward and backward representations of large portions of the environment, rather than complete panoramic visual representations. The advantage of the scheme is its simplicity – it is a low resolution, appearance based method that requires only consistency in the visual appearance of the environment. There is no geometric processing of scenes and no feature extraction or tracking. The disadvantages of the scheme are its sensitivity to illumination variation and inability to recognise new images as being rotated versions of stored template images. These issues were addressed in outdoor environments by the second visual processing method, Image Histograms Matching.
Ball, David, Scott Heath, Janet Wiles, Gordon Wyeth, Peter Corke, and Michael Milford. “OpenRatSLAM: an open source brain-based SLAM system.” Autonomous Robots 34, no. 3 (2013): 149-176.
Approach 3: ORB based visual template matching
Zhou, Sun-Chun, et al. 2017 proposed an ORB-based method, which is employed to extract features from images as visual template. When the current image matches prior visual templates, it is considered that robot reached this place previously. Otherwise, a new visual template is added to local view cells.
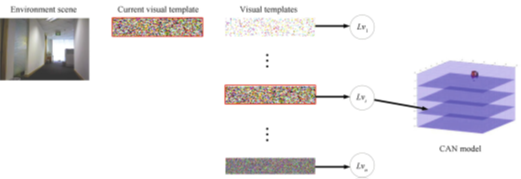
Templates matching process for local view cells. ORB features are extracted from environment scenes as visual template which is compared against all visual templates associated with local view cells . When current visual template matches a prior template in visual templates, the associated local view
  fires and injects energy to pose cells. Otherwise, add a new local view cell
  to
to  .
.
Zhou, Sun-Chun, Rui Yan, Jia-Xin Li, Ying-Ke Chen, and Huajin Tang. “A brain-inspired SLAM system based on ORB features.” International Journal of Automation and Computing14, no. 5 (2017): 564-575.
Approach 4: RGB-D based visual template matching (Intensity Scanline Profiles)
Tian, Bo, et al. 2013 propose a RGB-D based visual template matching approach. The main idea of visual processing method of Tian’s work based on RGB-D information in the following Fig. Intensity profiles of neighbouring environment scenes are firstly extracted. Then, these profiles are processed by a sum of absolute differences (SAD) method to get the distance . This distance is the sum of absolute differences between pixels value in these intensity profiles. Each distance
  from both RGB and depth frames are finally assigned by using different weights to construct the distance
 . It extracts one dimensional intensity profiles from both RGB and depth images. And these one dimensional intensity profiles are processed to calculate the distance between current image and recorded visual templates in local view cells. This method discards much information from physical environment, although it is simple and efficient.
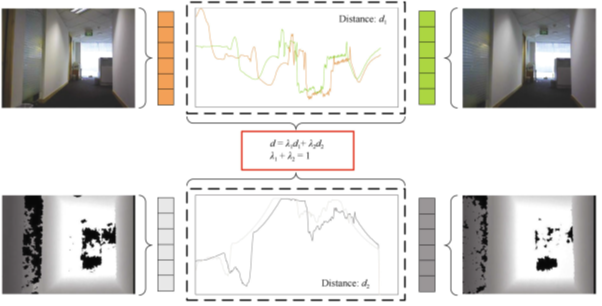
A pair of neighbouring RGB-D frames is showed. The top row is RGB information. The bottom row is depth information. Both RGB and depth information are captured simultaneously. And then, intensity profiles of neighbouring environment scenes are extracted. These intensity profiles are processed by a sum of absolute difference to get a distance  . Distances
  from RGB and depth images are weighted and then contributed to
  , which is used to distinguish different scenes.
Zhou, Sun-Chun, Rui Yan, Jia-Xin Li, Ying-Ke Chen, and Huajin Tang. “A brain-inspired SLAM system based on ORB features.” International Journal of Automation and Computing14, no. 5 (2017): 564-575.
Tian, Bo, Vui Ann Shim, Miaolong Yuan, Chithra Srinivasan, Huajin Tang, and Haizhou Li. “RGB-D based cognitive map building and navigation.” In Intelligent Robots and Systems (IROS), 2013 IEEE/RSJ International Conference on, pp. 1562-1567. IEEE, 2013.
Approach 5: Cylinder Landmarks based visual template matching
Cylinder Recognition System
Prasser, et al. 2003 propose a cylinder landmarks based visual place recognition approach. The vision problem was simplified by using a system of artificial visual landmarks. Coloured sheets of paper were rolled into 210 mm tall cylinders with a diameter of 90 mm. Cylinder colour schemes were split between the upper and lower halves of the cylinder. Four different colours – red, green, blue, and magenta – provided a total of 16 types of unique landmark. The vision system could report the bearing, range to and colour of cylinders within its field of vision, along with an associated uncertainty value for each reading (Prasser and Wyeth 2003). Cylinders were consistently visible at ranges between one and three metres, with a distance uncertainty of about 10%.
Prasser, D. and Wyeth, G., 2003, September. Probabilistic visual recognition of artificial landmarks for simultaneous localization and mapping. In Robotics and Automation, 2003. Proceedings. ICRA’03. IEEE International Conference on (Vol. 1, pp. 1291-1296). IEEE.
Approach 6: Image Histograms based visual template matching
Image Histograms Matching
Milford MJ proposed a histogram matching system for outdoor, which was developed for generating the local view. Outdoor experiments were performed on a robot platform with a panoramic camera. The larger field of view and greater variations in illumination required a more sophisticated vision processing system. A histogram matching system was developed for generating the local view. Histograms are invariant to rotations about the camera-axis, allowing recognition of familiar places with novel robot orientations. The red-green-blue colour space was used because it is more robust to changes in illumination in the testing environments than the camera’s native YUV colour space (Tews, Robert et al. 2005).
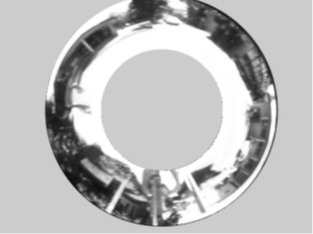
Region of the panoramic image used to generate histograms
Only part of the camera’s panoramic image is used to produce an image histogram, as shown in the upper Fig. Other areas of the image contain no useful information. After conversion from YUV to a normalised red-green-blue colour space, the image was used to calculate a 32 × 32 two-dimensional histogram of the red-green components. From a local view perspective, these histograms serve the same purpose as the 12 × 8 image templates described in the previous section.
As the robot moves around the environment, the current image histogram is either matched to an already learned histogram or added to the reference set. The distance between two histograms, , is calculated using a modified
  statistic:
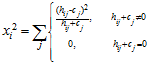 (3)
(3)
where  is the reference histogram and c is the current histogram. The j subscript refers to the bin number within each histogram.
Each reference histogram has an associated local view cell that is activated by similar new histograms. New local view cells are created for each new reference histogram. The activity level of a local view cell,  , is calculated using the
  distance, and normalised:
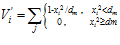 (4)
(4)

The constant  is a distance threshold beyond which a cell is inactive.
P 103 ~ P111 in Michael’s Book, 2008
Milford MJ. Robot navigation from nature: Simultaneous localisation, mapping, and path planning based on hippocampal models. Springer Science & Business Media; 2008 Feb 11.
Some extension content
Extracting Orientation Information
The approach that was used incorporates a compass to provide robot orientation information. The compass is assumed only to be locally consistent rather than globally accurate. Other methods of determining relative orientation such as feature tracking in the panoramic images would also be suitable under this approach.
Upon creation each local view cell stores not only the image template but also the compass orientation. The compass orientation when each image template  is first stored becomes the reference orientation
 . When the robot passes through the same environment location again, the difference in orientation,
  , is calculated and converted into the discrete heading space of the pose cells:
 (5)
(5)
where  is the relative orientation, α is the current compass orientation, and
  is the angular width of a pose cell.
  has a value of 10 since each pose cell initially represents 10 degrees of orientation.
Eqs. 8 and 9 were adjusted to incorporate the extra relative orientation information stored with each local view cell. Equation 8 became:
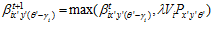 (6)
(6)
This equation reinforces the association between the reference orientation version of the histogram template and the pose cells that were active the first time it was seen. Multiple viewings of an image always reinforce the original template association, regardless of the orientation of the robot each time.
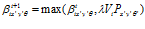
To re-localise the robot, active local view cells inject energy into the pose cells. Which pose cells are activated depends on the relative orientation  of the current image, which determines the target of the LV-PC links. The change in pose cell activation due to visual input,
 , is given by:
 (7)
(7)
The  subscript shifts the activity injection point within the pose cells to adjust for the shift in orientation between the original vision template and the current image.
Learning Visual Scenes
Visual scenes are associated with the robot’s believed position by a learning function which increases the connection strengths between co-activated local view and pose cells. The updated connection strength, , is given by:
 (8)
(8)
where  is the activity level of the local view cell and
  is the activity level of the pose cell. These links form the pose-view map.
Re-localising Using Familiar Visual Scenes
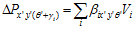
The pose-view map can be used to inject activity into the pose cells, which is the mechanism that RatSLAM uses to maintain or correct its believed pose. Active local view cells project their activity into the pose cells to which they are associated, by an amount proportional to the association strength. The change in pose cell activity, , is given by:
 (9)
(9)
The learning method that RatSLAM uses to build the pose-view map cannot usefully associate raw camera data with pose cells. The data must be processed to reduce the dimensionality of the camera image while preserving distinctive information. The single layer learning mechanism between the local view and pose cells works best when the local view is a sparse feature vector, as this avoids problems with linearly inseparable inputs. To constrain the local view structure to a practical number of cells, the vision processing system should perform spatial generalisation; activity in the local view cells should not change significantly for small changes in robot pose.
P 103 ~ P111 in Michael’s Book, 2008
Milford MJ. Robot navigation from nature: Simultaneous localisation, mapping, and path planning based on hippocampal models. Springer Science & Business Media; 2008 Feb 11.
Visual Data Association
Gordon Wyeth, Michael Milford, Will Maddern. From Rats to Robots: Bio-inspired Localization and Navigation.